1. Homepage PCOSKBR2 has an interactive and user-friendly interface. The homepage provides a short description of the database and its functionalities. The database has manually curated genes associated with PCOS and other diseases, SNPs, and pathways associated with these genes.
Data can be retrieved using the navigation tabs (menu bar) on the top of the webpage

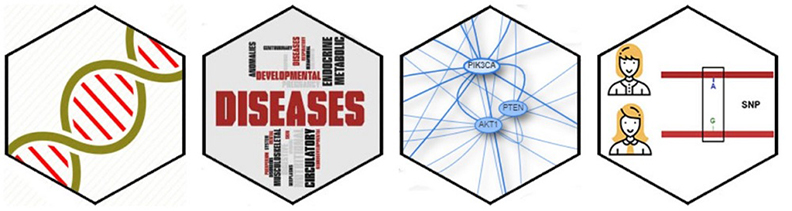
or by using direct links (hexagons) on the homepage.
2. Search
a. Quick Search
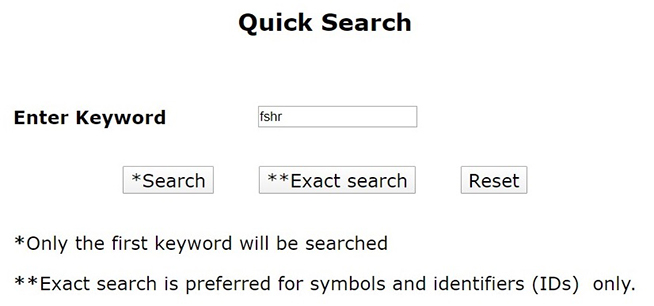
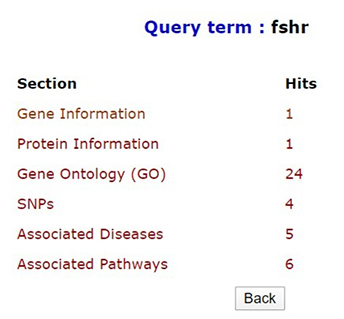
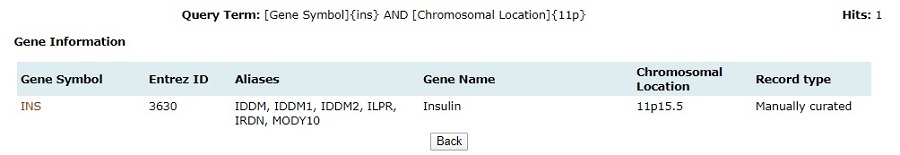
Quick search option in PCOSKBR2 allows users to query the whole database based on keywords. The number of hits, from each section of the database along with section name, is listed as a result. The results are hyperlinked to the detailed search result of the respective section.
There are two search options: 1. Search, 2. Exact search. Exact search matches the precise keyword, displays specific hits for any id or symbol.
Note: Only the first keyword will be considered for search if multiple keywords are given separated by space. Any other delimiter is invalid.
b Advanced Search
Advanced search in PCOSKBR2 allows users to search the database section-wise by selecting fields and applying logical operators (AND, OR, NOT).
Title |
Sub-headings |
Description |
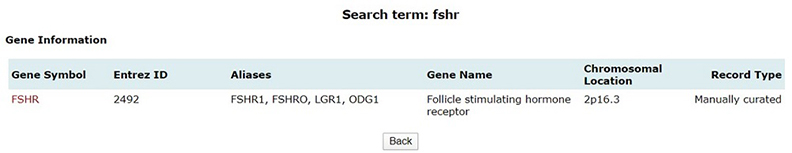
Gene Information |
Gene Symbol |
Unique gene symbol provided/ assigned by HUGO Gene Nomenclature Committee (HGNC) |
Aliases |
Synonyms or known terms for genes. These are unapproved nomenclature used in old literature. |
Entrez Gene ID |
A unique identifier number assigned to every new gene record by NCBI |
Gene Name |
A unique name provided/ assigned by HUGO Gene Nomenclature Committee (HGNC) |
Chromosomal Location |
Provides information regarding the location of gene on chromosome. |
Gene Summary |
It provides the short description regarding the gene from NCBI gene. |
RefSeq DNA |
RefSeq DNA ID |
RefSeq mRNA |
RefSeq mRNA ID |
Gene Ontology |
Gene Symbol |
Symbol or aliases of the gene |
GO ID |
The Gene Ontology (GO) ID |
Ontology |
Biological domain with three aspects: Molecular function, Cellular components and Biological processes. |
Function |
Sections under three main biological domains. |
Protein Information |
Protein Name |
It reports the name(s) assigned to the protein in NCBI |
Function |
A short description regarding the protein from UniProt. |
RefSeq Protein |
RefSeq Protein ID |
UniProt |
A unique accession number assigned to the prduct. A protein can have more than one accession number. |
RCSB PDB |
A unique identifier assigned to new entry of a structure reported in Protein Data Bank (PDB) |
Associated Pathways |
Gene Symbol |
Symbol or aliases of the gene |
Pathway Name |
Name assigned to the process. |
Pathway ID |
A unique identifier assigned to pathway in KEGG pathways and Reactome |
SNPs |
Gene Symbol |
Symbol or aliases of the gene |
SNP ID |
A unique identification code assigned to the mutation in gene sequence. |
Upstream sequence |
Upstream Sequence of SNP |
SNP |
Change in the nucleotide |
Downstream sequence |
Downstream Sequence of SNP |
Associated Diseases |
Gene Symbol |
Symbol or aliases of the gene |
Disease |
Disease names based on ICD- 11 classification and MeSH headings |
Reference |
Pubmed ID |
Identifier for published and freely- accessible articles |
Title |
Title of the article |
Author |
Author(s) of the article |
Abstract |
Abstract of the article |
Source |
Original source of article |
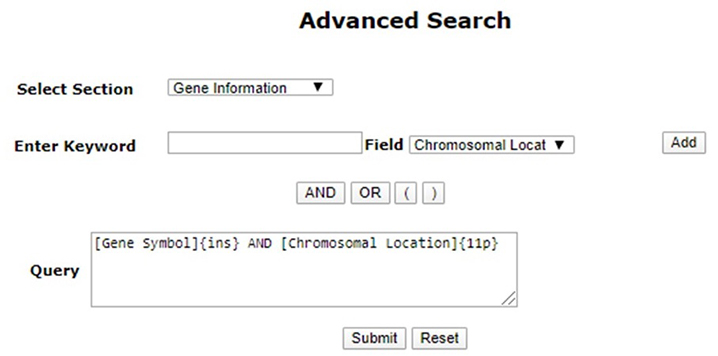
Note: Using “AND”, “OR” is mandatory for joining multiple queries
3. Browse
Browse enables users to surf the database for genes, miRNAs, SNPs, diseases, pathways, and ontology associated with PCOS. The information available on each page is explained below:
Genes:The genes associated with PCOS are divided into 3 sets, manually curated, expression study, and other databases. All of these can be browsed in the gene browse page. Links to complete information on manually curated genes are also provided and the rest are hyperlinked to respective NCBI page. Complete information on the manually curated genes has detailed information about protein, gene ontology, associated diseases, associated pathways, and associated literature references.
miRNAs: These options list all the miRNAs associated with PCOS and all of them are linked to the complete information page.
SNPs: This option lists all SNPs associated with PCOS, along with links to reference literature and the dbSNP database.
Diseases: The diseases associated with genes present in the database can be viewed using this option.
Pathways:The different metabolic/signaling pathways associated with genes in the database can be browsed. Links to the KEGG/Reactome pathway database is provided here.
Ontologies: The different ontology terms associated with genes in the database can be browsed here and ontologies are linked to GO page. Each ontology term is associated with many genes, and genes are also linked to pathways and diseases in the detailed information page of ontology.
All the above-mentioned pages can be filtered, queried using keywords, and browsed by alphabets. One or more of these can be clubbed to get more specific results.
4. Tools
4.1 Comorbidity analysis
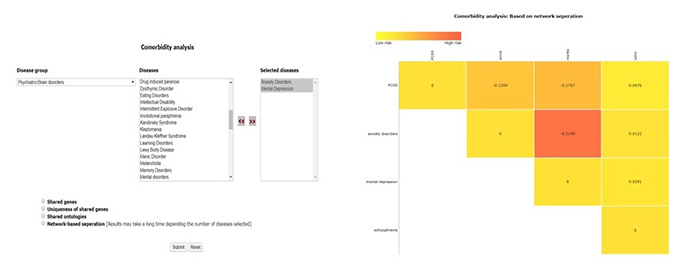
This tool can be used to predict comorbidity based on shared genes and their ontologies, uniqueness of the shared genes, and the network-based separation between them. For more details of the methodology refer to (paper link).
The home page of the tool has a drop-down list of disease groups, selecting any of the groups will pop up another column with disease names belonging to that group.
User can select any number of disease names and use >> symbol to move the name in “selected names column”
Disease names can also be selected form different groups.
Results are displayed as heat maps. Darker the shade of red more is the comorbidity of the disease pair. Results can be downloaded as spreadsheet or image files using right click.
4.2 Network analysis
This tool can be used for visualization of disease networks, identification of enriched pathways and prioritization of disease genes. There are 3 modules which can be are interconnected, output of one page can be input of next or all the 3 can be used for individual analysis. Home page of the tool have graphical representation for using the tool. Selection of disease names is same as the above tool.
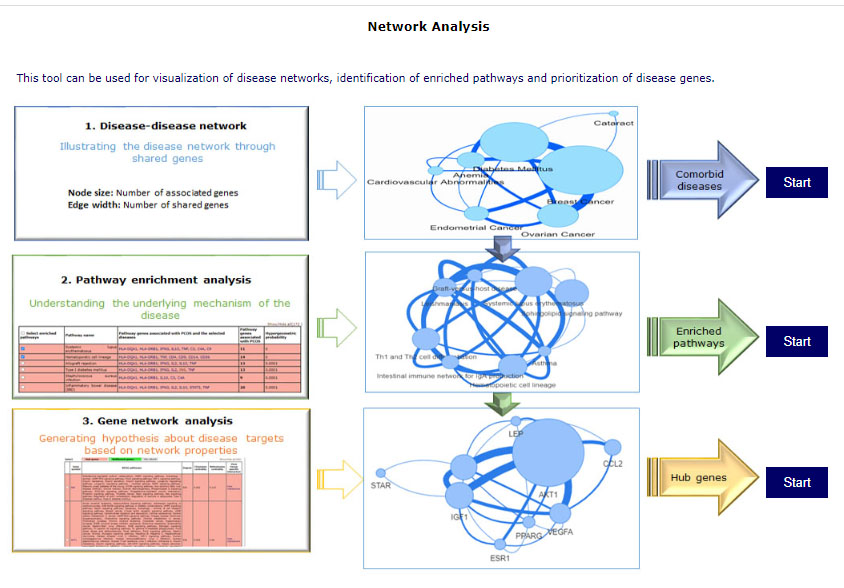
Module 1: Disease-disease network – shows the connectivity of diseases in terms of shared genes. Users can select disease to visualize the network and get tabular information of shared diseases.
Using either of the two tabs “Pathway enrichment analysis” or “Gene network analysis”, the results of the disease-disease network can be taken for both pathway and gene analysis.
One can select analysis to be done from data that is either KEGG or Reactome databases by using the dropdown available.
Module 2: Pathway enrichment analysis – For selected diseases, this tool gives a list of enriched pathways. Pathways can be selected to visualize pathway networks or proceed to a gene analysis. Users can add/delete diseases by selecting edit their disease list using the “Edit disease” button on the top right corner. The results of this page can be taken further for gene network analysis by clicking on “Gene network analysis” while a pathway network of selected pathways can also be explored using “View network” option.
Module 3: Gene network analysis – This tool prioritizes disease genes. It provides user with hub genes and bottleneck genes marked in red and green respectively. It provides an output of a list of genes with their network properties and tissue specific interactions for each gene. A gene network can be visualized on selecting the pathways of interest and clicking on the “View network” tab.
For each gene, its interactions with other genes and tissue specific interactions can be visualized using the “View Interactions” option. Tissue specific interactions can be visualized using the “Tissue” filter.
One can select hub and bottleneck genes at once using the “Hub genes” and “Bottleneck genes” selection box respectively.
4.3 Venn analysis
This tool can be used to illustrate the unique and/or common genes, pathways and ontologies for 2 or more (up to 6) diseases.
Home page for all the venn looks like this
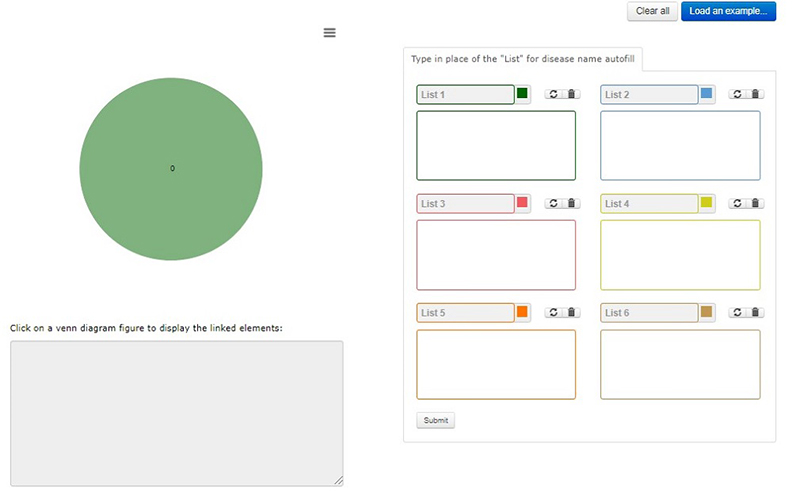
Disease name can be typed in the box for autofill from database. 
After click on “submit” the page will be redirected to output page.

Load an example will load an example and it can be submitted to understand the output.
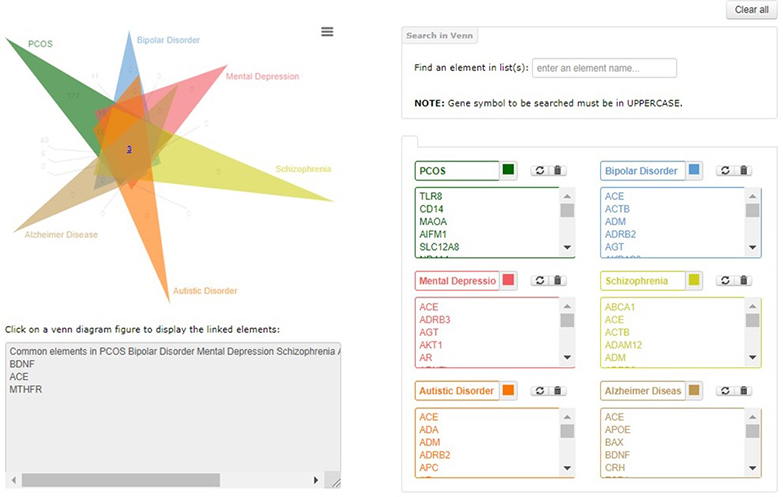
Top left of the page shows the venn diagram, with number of uniquely common elements. The numbers are hyperlinked to the box below; list of elements will pop up there. List can be copied from there to any editor.
 Type in box, to find elements in the venn diagram. Type in box, to find elements in the venn diagram.
 The image or list of the venn diagram can be downloaded from options of this icon in top right of diagram. The image or list of the venn diagram can be downloaded from options of this icon in top right of diagram.
 Clear all button can be used to go back to the input page. Clear all button can be used to go back to the input page.
|
